JAPANESE CANDLESTICKS
The Japanese have been using candlesticks since the 17th century to analyze rice prices. Candlesticks were introduced into modern technical analysis by Steve Nison in his book Japanese Candlestick Charting Techniques.
Candlesticks contain the same data as a normal bar chart but highlight the relationship between opening and closing prices. The narrow stick represents the range of prices traded during the period (high to low) while the broad mid-section represents the opening and closing prices for the period.
- If the close is higher than the open - the candlestick mid-section is hollow or shaded blue/green.
- If the open is higher than the close - the candlestick mid-section is filled in or shaded red.
The advantage of candlesticks is the ability to highlight trend weakness and reversal signals that may not be apparent on a normal bar chart.
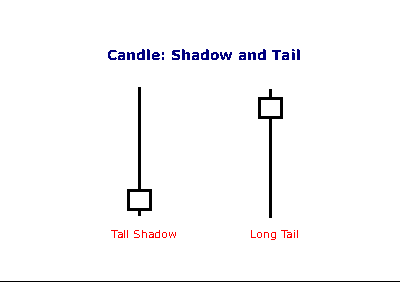
Shadow and Tail
The shadow is the portion of the trading range outside of the body. We often refer to a candlestick as having a tall shadow or a long tail.
- A tall shadow indicates resistance;
- A long tail signals support.


2 comments:
I enjoyed this post, even though I am not a trader. I found it informative and clearly presented. As someone who spends a lot of time looking at a computer screen, I find the black background causes more eye strain, but it does give an elegant look to the blog. I also don't know if I just missed it, but I didn't see much personal information about you - what makes you tick, why you chose this profession and what you enjoy most about it. That would have been interesting to me. Good luck.
http://www.advice2rich.blogspot.com
NO TECHNICALS ONLY PURE PROFIT
Post a Comment